- Welcome my DevOps blog./
- 🔰Posts/
- 🗂️My Trainings/
- AWS Trainings and Certifications/
- 🏅AWS Certified Solutions Architect - Associate/
- Solutions Architect: AWS Monitoring, Audit and Performance/
Solutions Architect: AWS Monitoring, Audit and Performance
Table of Contents
ℹ️ Associate‑level extension of the Cloud Monitoring section from the AWS Cloud Practitioner series.
| AWS Certifications Series » | |
|---|---|
| AWS Cloud Practitioner | AWS Solution Architect |
CloudWatch #
CloudWatch Metrics #
- CloudWatch provides metrics for all AWS services
- A metric is a monitored variable (e.g., CPUUtilization, NetworkIn)
- Metrics live in namespaces and can include up to 30 dimensions (e.g., instance ID, environment)
- All metrics have timestamps
- Supports dashboards for visualisation
- You can publish custom metrics (e.g., RAM usage)
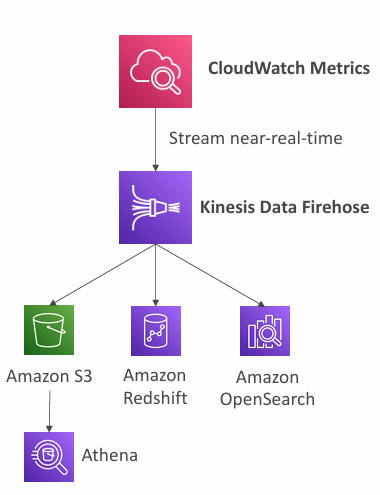
CloudWatch Metric Streams #
- Continuously streams CloudWatch metrics to your chosen destination with low‑latency, near‑real‑time delivery
- Supports Kinesis Data Firehose targets and third‑party tools like Datadog, Dynatrace, New Relic, Splunk, Sumo Logic
- You can filter which metrics are streamed to control volume and cost
CloudWatch Logs #
- Log groups represent applications; log streams represent individual instances, files, or containers
- Supports configurable retention policies (from 1 day to 10 years, or never expire)
- Logs can be sent to:
- Logs are encrypted by default
- Can setup KMS-based encryption with your own keys
CloudWatch Logs sources:
- Logs can come from the SDK, CloudWatch Logs Agent, or the Unified Agent
- Elastic Beanstalk collects app logs; ECS collects container logs
- Lambda automatically sends function logs
- VPC Flow Logs capture network traffic; API Gateway and CloudTrail can emit logs
- Route 53 can log DNS queries
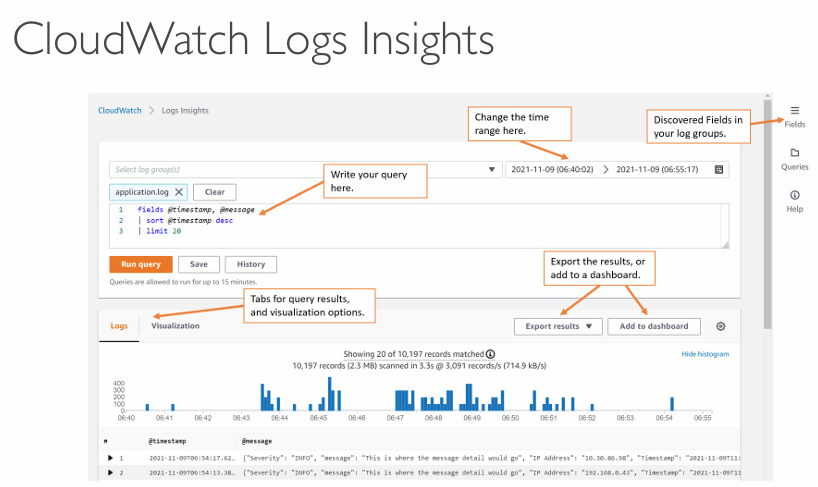
CloudWatch Logs Insights #
- Lets you search and analyse log data stored in CloudWatch Logs using a purpose‑built query language
- Automatically extracts fields from AWS services and JSON logs
- Supports filtering, field selection, aggregations, sorting, and limiting results
- Queries can be saved and added to CloudWatch Dashboards
- Can query multiple log groups across accounts
- It’s a query engine, not a real‑time streaming system
CloudWatch Logs - S3 Export #
- Log data can take up to 12 hours to become available for export CloudWatch Logs Amazon S3
- The API call is CreateExportTask
- Not near-real time or real-time… use Logs Subscriptions instead
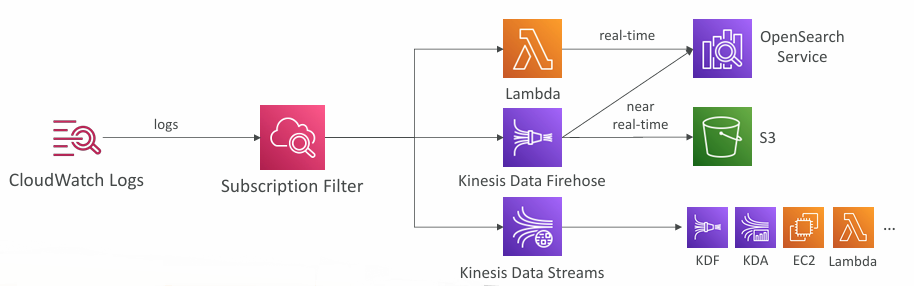
CloudWatch Logs Subscriptions #
- Streams real‑time log events from CloudWatch Logs for processing and analysis
- Can deliver logs to Kinesis Data Streams, Kinesis Firehose, or Lambda
- Uses subscription filters to control which log events are forwarded
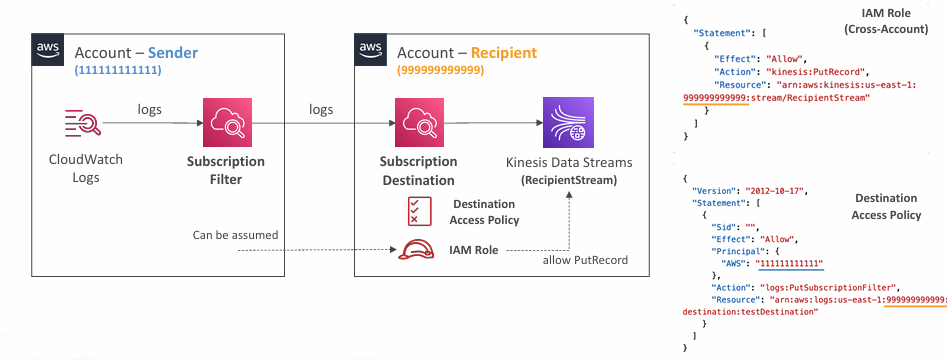
Cross-Account Subscription - send log events to resources in a different AWS account (KDS, KDF).
CloudWatch Logs for EC2 #
- EC2 instances don’t send logs to CloudWatch by default - you must install and configure the CloudWatch agent
- The agent pushes selected log files and requires the correct IAM permissions
- The same agent can also be used on on‑premises servers
CloudWatch Logs Agent & Unified Agent #
- For virtual servers (EC2 instances, on-premises servers…)
- CloudWatch Logs Agent
- Old version of the agent
- Can only send to CloudWatch Logs
- CloudWatch Unified Agent
- Collect additional system-level metrics such as RAM, processes, etc…
- Collect logs to send to CloudWatch Logs
- Centralized configuration using SSM Parameter Store
CloudWatch Unified Agent - Metrics #
- Collects detailed Linux/EC2 system metrics:
- CPU (user, system, idle, steal)
- disk usage and I/O
- RAM stats (free, inactive, used, total, cached)
- network connections/traffic (number of TCP and UDP connections, net packets, bytes)
- process counts
- swap usage
- Complements EC2’s built‑in high‑level metrics (CPU, disk, network) with deeper, host‑level visibility
CloudWatch Alarms #
- Alarms monitor metrics and trigger notifications based on thresholds (max, min, %, sampling, etc.)
- Alarm states are OK, INSUFFICIENT_DATA, and ALARM
- The period defines the evaluation window in seconds; high‑resolution custom metrics support 10s, 30s, or 60‑second multiples
CloudWatch Alarm Targets #
- Stop, Terminate, Reboot, or Recover an EC2 Instance
- Trigger Auto Scaling Action
- Send notification to SNS (from which you can do pretty much anything)
CloudWatch Alarms - Composite Alarms #
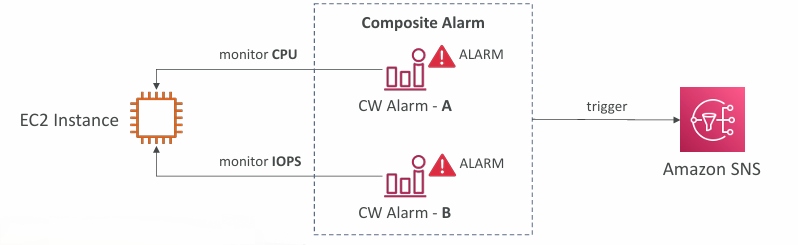
- Standard CloudWatch alarms track a single metric, while composite alarms evaluate the states of multiple alarms
- Support AND/OR logic, helping reduce noise by triggering only when complex conditions are met
To test alarms and notifications, set the alarm state to Alarm using CLI:
aws cloudwatch set-alarm-state --alarm-name "myalarm" --state-value ALARM --state-reason "testing purposes"
CloudWatch Network Synthetic Monitor #
- Monitors connectivity between your AWS‑hosted applications and on‑premises environments, detecting issues like latency, jitter, and packet loss
- Requires no agents and tests ICMP or TCP traffic to on‑prem destinations over Direct Connect or Site‑to‑Site VPN
- Publishes all results as CloudWatch metrics
Amazon EventBridge #
More info: Amazon EventBridge
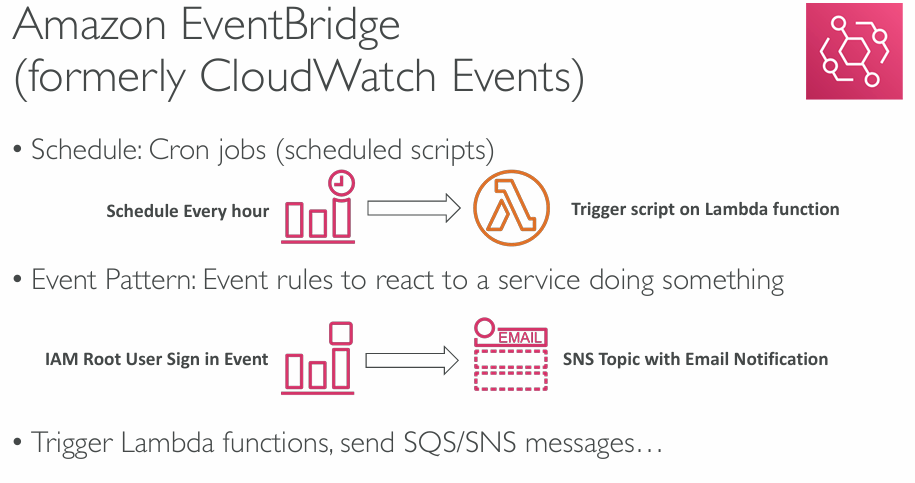
- Schedule: Cron jobs + Event Bus
- Event Pattern: Event rules to react to a service doing something
- Trigger Lambda functions, send SQS/SNS messages
🙋🏻 Question: Give me some example AWS EventBridge Sources. It is said that EventBridge is equivalent to the Cron Jobs but I understand it can also be triggered by an event. Can you clarify?
EventBridge has two completely different triggering models:
1. Scheduled rules (cron/ rate)
This is the part people compare to cron jobs.
Examples:
- Run a Lambda every hour
- Trigger a workflow every day at 02:00
- Clean up old data every 15 minutes
- Rotate a job weekly
This is the cron‑like functionality.
2. Event‑driven rules (the real power)
EventBridge can listen to events emitted by AWS services, SaaS providers, or your own apps, and trigger targets when something happens.
This is the event bus functionality - far more powerful than cron.
Examples of AWS EventBridge event sources:
- Compute - Lambda function invocations failure, EC2 instance state changes (start, stop, terminate), ECS task state changes, EKS cluster events
- Storage - S3 object-level events
- Networking - VPC flow log delivery failures, API Gateway request events
- Security - IAM access key lifecycle events, GuardDuty findings, Security Hub findings, AWS Config compliance changes, CloudTrail events (via EventBridge)
- Database - DynamoDB table state changes, RDS instance failover events, Aurora cluster events
- Messaging - SNS topic events, SQS queue events, Step Functions execution status changes
- Management & Monitoring - CloudWatch Alarms, Auto Scaling lifecycle events, AWS Backup job events, AWS Health Dashboard events
- SaaS integrations - Auth0, Zendesk, Shopify, Datadog, Stripe, Many others…
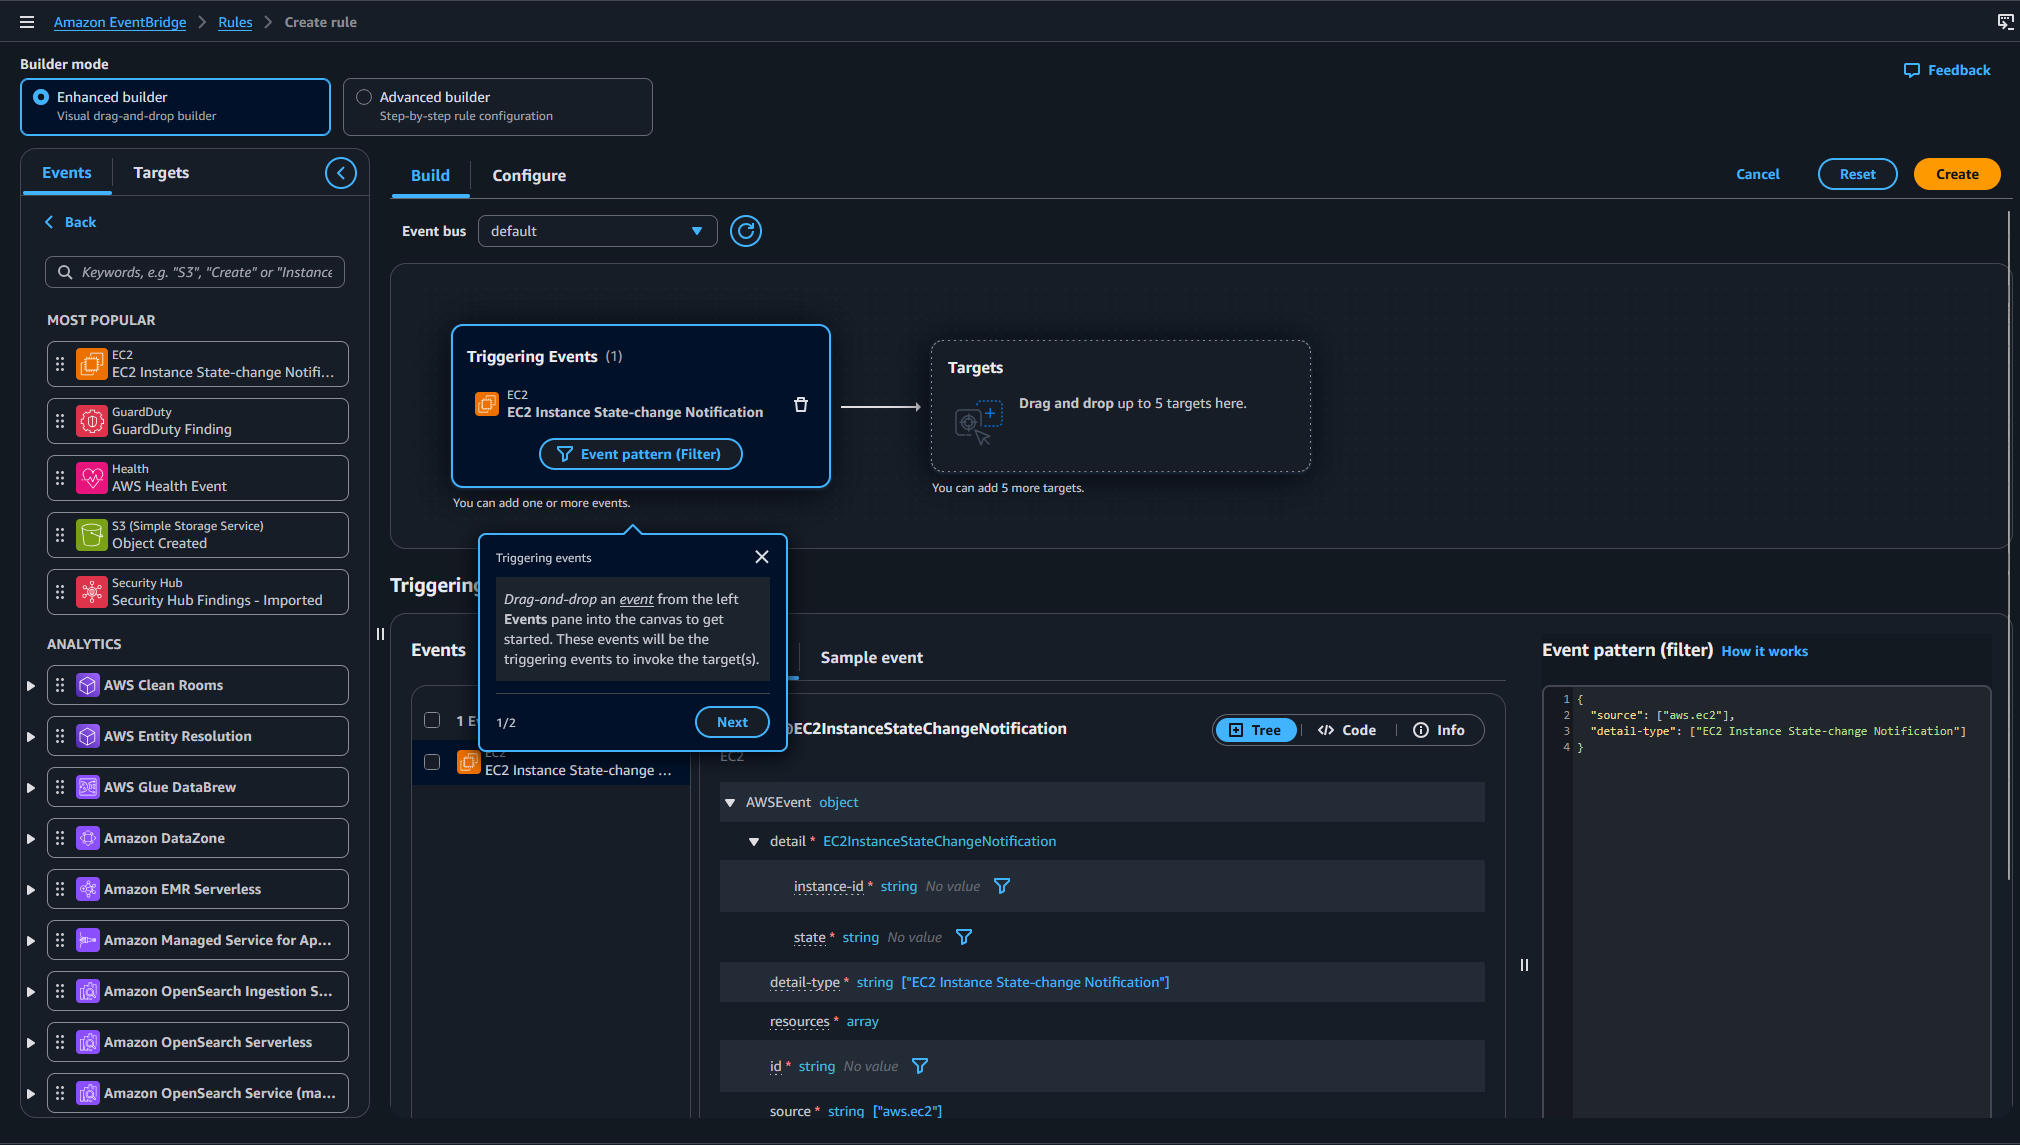
EventBridge Create rule #
CloudWatch Insights #
- CloudWatch Container Insights
- ECS, EKS, Kubernetes on EC2, Fargate, needs agent for Kubernetes
- Metrics and logs
- CloudWatch Lambda Insights
- Detailed metrics to troubleshoot serverless applications
- CloudWatch Contributors Insights
- Find “Top-N” Contributors through CloudWatch Logs
- CloudWatch Application Insights
- Automatic dashboard to troubleshoot your application and related AWS services
CloudWatch Container Insights #
- Collects, aggregates, and summarises container metrics and logs
- Supports ECS, EKS, Kubernetes on EC2, and Fargate for both ECS and EKS
CloudWatch Lambda Insights #
- Provides monitoring and troubleshooting for Lambda‑based serverless applications
- Captures system‑level metrics (CPU time, memory, disk, network) and diagnostic data like cold starts and worker shutdowns
- Delivered as a Lambda Layer
CloudWatch Contributor Insights #
- Analyses log data to produce time‑series showing top‑N contributors and total unique contributors
- Helps identify “top talkers” and pinpoint hosts, users, or URLs impacting performance
- Works with AWS‑generated logs like VPC Flow Logs and DNS logs
- You can build custom rules or use AWS‑provided sample and built‑in rules to analyse CloudWatch Logs and other AWS service metrics
CloudWatch Application Insights #
- Provides automated dashboards that show potential problems with monitored applications, to help isolate ongoing issues
- Your applications run on Amazon EC2 Instances with select technologies only (Java, .NET, Microsoft IIS Web Server, databases…)
AWS CloudTrail #
- Provides governance, compliance, and audit visibility for your AWS account, and is enabled by default
- Records all API activity from the console, SDKs, CLI, and AWS services
- Logs can be sent to CloudWatch Logs or S3, and trails can cover all regions or a single region
- When something is deleted or changed, CloudTrail is the first place to investigate
CloudTrail Events #
Management events capture operations performed on AWS resources, such as security changes, network configuration, or creating trails. Trails log these by default, and you can separate Read (non‑mutating) from Write (resource‑changing) actions.
Data events record high‑volume, resource‑level activity and are disabled by default. They include S3 object‑level actions (GetObject, PutObject, DeleteObject) and Lambda Invoke operations, with optional separation of Read and Write events.
CloudTrail Insights #
- Detects unusual account activity such as misconfigured provisioning, service‑limit spikes, bursts of IAM actions, or gaps in routine operations
- Builds a baseline from normal management events, then analyses write events to spot anomalies
- Anomalies appear in the CloudTrail console, are delivered to S3, and also generate EventBridge events for automation
CloudTrail Events Retention #
- Events are stored for 90 days in CloudTrail
- To keep events beyond this period, log them to S3 and use Athena
AWS Config #
AWS Config is a service that continuously tracks and records the configuration of your AWS resources, then evaluates those configurations against rules you define.
It gives you a clear history of how resources have changed over time, helps you detect drift, and supports compliance by showing whether resources meet required policies.
You can use AWS‑managed rules or create custom ones, and every evaluation result is visible through dashboards, timelines, and detailed compliance reports. AWS Config Rules does not prevent actions from happening (no deny).
Use EventBridge to trigger notifications when AWS resources are non compliant:

CloudWatch vs CloudTrail vs Config #
| CloudWatch | CloudTrail | Config |
|---|---|---|
| Performance monitoring (metrics, CPU, network, etc…) & dashboards | Record API calls made within your Account by everyone | Record configuration changes |
| Events & Alerting | Can define trails for specific resources | Evaluate resources against compliance rules |
| Log Aggregation & Analysis | Global Service | Get timeline of changes and compliance |
ELB Example #
| CloudWatch | CloudTrail | Config |
|---|---|---|
| Monitoring Incoming connections metric | Track who made any changes to the Load Balancer with API calls | Track security group rules for the Load Balancer |
| Visualize error codes as % over time | Track configuration changes for the Load Balancer | |
| Make a dashboard to get an idea of your load balancer performance | Ensure an SSL certificate is always assigned to the Load Balancer (compliance) |
» Sources « #
CloudWatch / CloudWatch Logs / CloudWatch Events (EventBridge):
» References « #
Cloud Practitioner: Cloud Monitoring
» Disclaimer « #
This series draws heavily from Stephane Maarek’s Ultimate AWS Certified Solutions Architect Associate 2026 course on Udemy.
His content was instrumental in helping me pass the certification.
| About the instructor | |
|---|---|
| 🌐 Website | 📺 YouTube |
| 𝕏 x.com |